Causality 2

Twice the causality

Carolina Torreblanca

University of Pennsylvania

Global Development: Intermediate Topics in Politics, Policy, and Data

PSCI 3200 - Spring 2025

Logistics

Assignments

  • Did you send me a quarto file? If not, please do

Announcements

  • This Wed: RStudio and Quarto workshop with Jeremy

Agenda for today

  • What is confounding?
  • Causality with observational data

Causality as Explanation

  • Last week, we discussed the fundamental problem of causal inference:

    • We can never observe what could have happened - or the counterfactual outcome
  • This prevents us from ever observing individual treatment effects … but when treatment assignment is independent of our outcomes….

  • We can estimate average causal effects

DAGs

One useful way to think about causality is using Directed Acyclical Graphs (DAGs)

  • Causal inference requires assumptions and DAGS are ways for us to visualize those assumptions
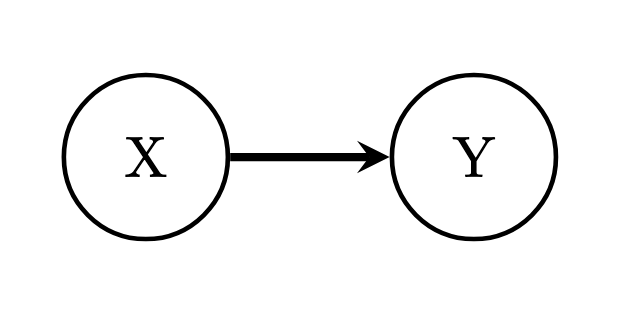
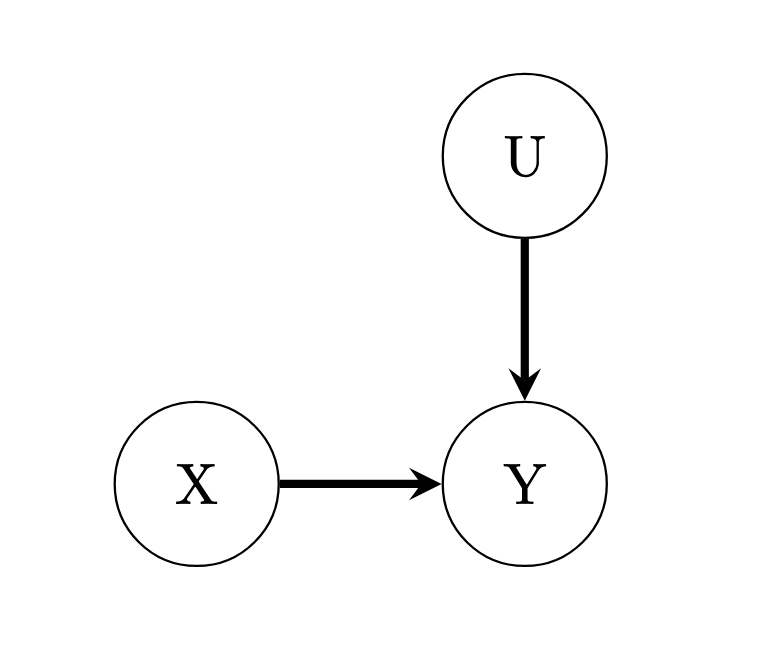
  • In a DAG, each node is a variable and the edge represents a causal relationship. For example “X causes Y”:

DAGS

Multicausality in DAGs

X and Y are independent if X is “separated” from other variables that go to Y.

DAGS

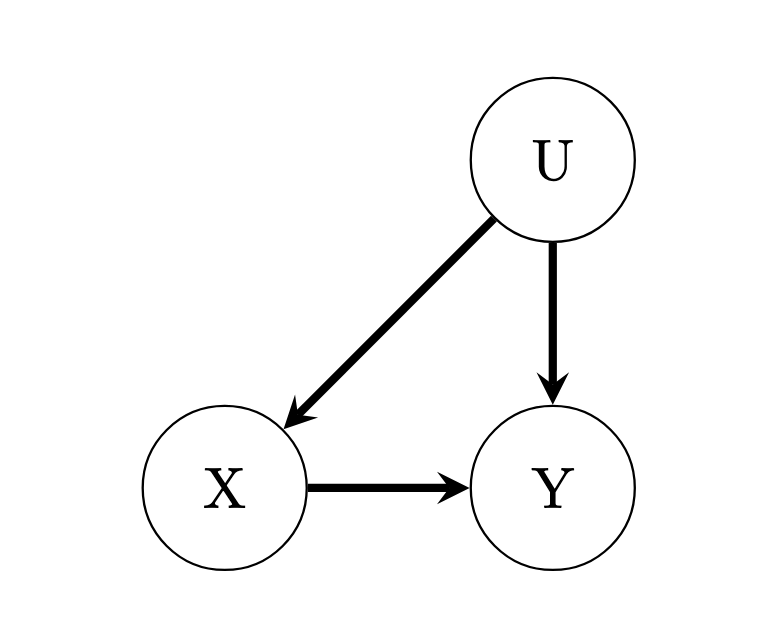
What if X and Y are both caused by some other variable, U? Are X and Y independent? Can we plug-in \(\bar{Y_c}\) and \(\bar{Y_t}\) and subtract?

  • U s a confounder

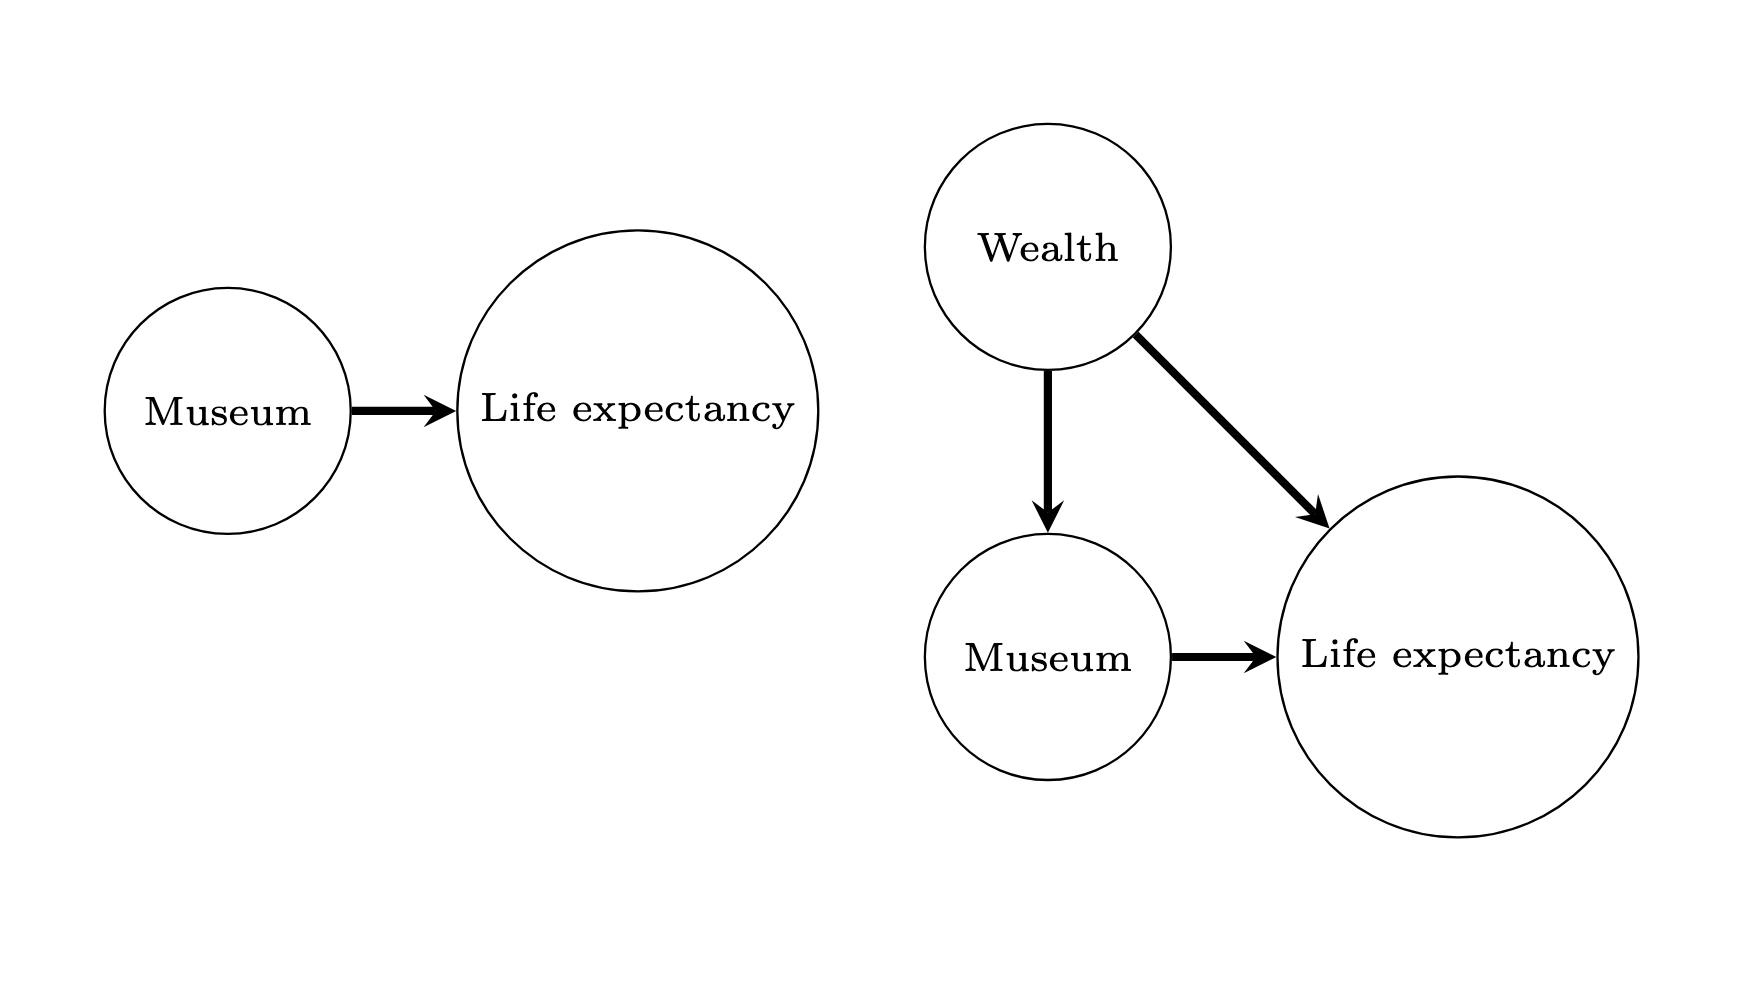
Confounders in the wild

Which is it?

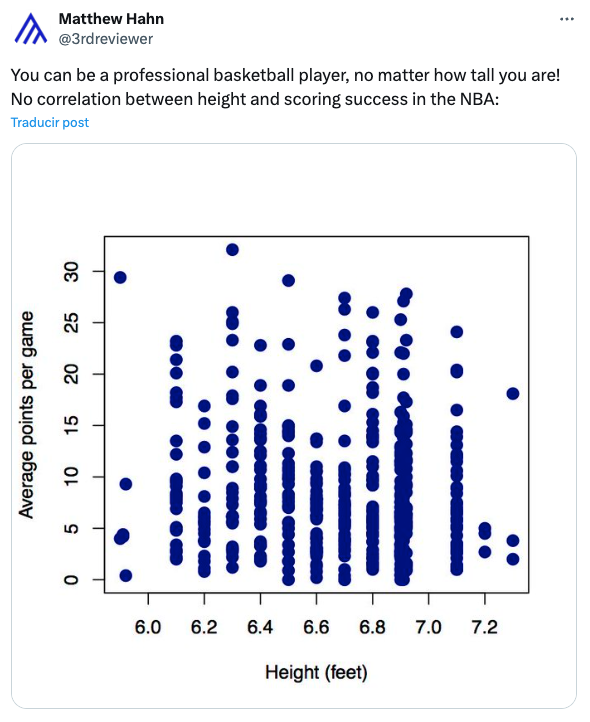
Selection as a confounder

Randomization as a way to get independence

  • Independence between treatment and outcome is a hard assumption!

  • One way to make it more convincing is to randomize treatment assignment: if treatment assignment depends on luck, not X, then we have a good theoretical reason to assume X and Y are independent.

Example from a RCT: Project STAR

  • Q: What is the causal effect of class size on educational outcomes?

  • What are some potential pitfalls?

  • Class size and educational outcomes are probably confounded:
    • Parent’s wealth
    • Where people live
    • What else?

Example from a RCT: Project STAR

  • Q: What is the causal effect of class size on educational outcomes?

  • Hypothesis: Kids learn better in smaller classrooms

  • Research Design: Randomize the size of classrooms!

Data & Code

star <- read.csv("./code/STAR.csv")
dim(star)
[1] 1274    4
head(star)
  classtype reading math graduated
1     small     578  610         1
2   regular     612  612         1
3   regular     583  606         1
4     small     661  648         1
5     small     614  636         1
6   regular     610  603         0
table(star$classtype)

regular   small 
    689     585 
summary(star$math)
   Min. 1st Qu.  Median    Mean 3rd Qu.    Max. 
  515.0   604.0   631.0   631.6   659.0   774.0 
Data & Code

## Two-way frequency tables
table(star$classtype, star$graduated)
         
            0   1
  regular  92 597
  small    74 511
## Two-way tables of proportions
prop.table(table(star$classtype, star$graduated), 1) 
         
                  0         1
  regular 0.1335269 0.8664731
  small   0.1264957 0.8735043
# summary
summary(star$math)
   Min. 1st Qu.  Median    Mean 3rd Qu.    Max. 
  515.0   604.0   631.0   631.6   659.0   774.0 
Difference-in-Means

What is the average causal effect of class size on education outcomes?

How would you answer this question?

  • Remember, we have kids randomly assigned to small classrooms and SAT scores.

Difference-in-Means

# 1. Mean Math score for people assinged to small classroom
math_treat <- mean(star$math[star$classtype=="small"]) 
# 2. Meam math score for people in regular classroms
math_control <-  mean(star$math[star$classtype=="regular"])
# 3. Mean reading for treatment
reading_treat <- mean(star$reading[star$classtype=="small"]) 
# 4. Reading control
reading_control <- mean(star$reading[star$classtype=="regular"])

### difference-in-means estimators ####
math_treat - math_control
[1] 5.989905
reading_treat - reading_control
[1] 7.210547

Can we do observational causal research?

  • Causality hinges on independence between treatment and outcome

  • By randomizing treatment assignment, RCTs fabricate independence

  • But not everything can or ought to be randomized!

  • Observational causal work relies on finding and leveraging accidentally or conditionally occurring random variation in treatment assignment

Natural- and Quasi-Experiments

Dealing with confounders using controls

  • If we feel theoretically confident that we can observe all variables that confound the relationship between X and Y, we can control for them and estimate causal effects

  • BIG BIG BIG assumption (called Conditional Independence Assumption)

  • We cannot do anything with confounders we cannot observe!

Does drinking wine make you live longer?

From Time magazine

Does drinking wine make you live longer?

  • The researchers compared only Italian men who were the same age, and ate about the same.
  • I.e., they “controlled” for age, diet, origin.
  • If nothing else confounds the relationship between drinking wine and life expectancy, then they identified a causal effect!
  • …. Do we believe them?

Wrapping up

  • Causality ALWAYS requires assumptions!
    • DAGs are good ways to clarify our assumptions
  • Whether our conclusions are causal or not depend on whether our assumptions hold
  • To a large degree, these assumptions refer to what we cannot see, and are un-testable!
  • Good research argues why a setting is well-suited to answer causal questions.