Democracy and Development

Author
Affiliation

Carolina Torreblanca

University of Pennsylvania

Agenda

  • Democracy as a consequence of development
  • Democracy as a cause of development
  • Fixed effects

Democracy and Development

From Acemoglu et. al. 2008

Two explanations

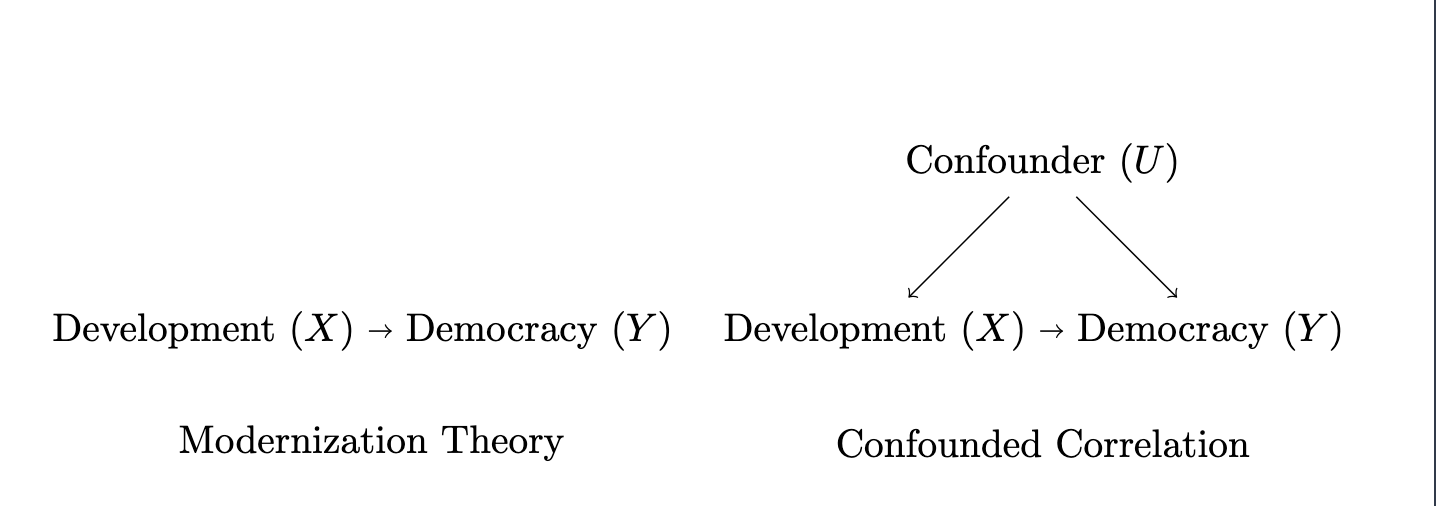
  1. Direct causal link

    • Development \(\rightarrow\) democracy
    • Democracy \(\rightarrow\) development
  2. Indirect link or correlation

    • Income \(\rightarrow\) regime survival
    • Omitted variable

Development as cause

Modernization Theory, Lipset (1960)

Development causes democracy

  • Economic development requires investing in education, infrastructure, urbanization…

    • Modernizing.
  • Modernization triggers changes making democracy more likely

    • Society becomes more complex and organized
    • Education facilitates democratic citizenship
    • Infrastructure and urbanization facilitate political competition

The Threat of Revolution

  • Acemoglu and Robinson (2001)
  • Rich elites control autocratic societies
    • But they fear revolution!
  • How to prevent it?
    • Democratize and redistribute some of the resources
  • Elites and non-elites are better off

Development as consequence

Democracy Spurs Development

Dictatorship, Democracy, and Development (Olson, 1993)

  • Autocrats want a wealthy country.

  • Why would citizens produce wealth if it can be expropriated by an autocrat?

    • Solution: Credibly tie your own hands with democratic institutions
  • By sharing political power and enshrining property rights, create incentives to produce wealth

  • Democracy \(\rightarrow\) development

Other Explanations

Democratic Survival

  • Democracy is established independently of development …

  • But development helps democracies survive

  • “The more well-to-do a nation, the greater the chances it will sustain democracy” (Lipset, 1959)

  • Empirical implications: There will be a correlation btw democracy and development even if development does not cause democracy!

Democracy and Development in Research

  • Are the theoretical arguments for \(Democracy \rightarrow Development\) convincing?

  • Are the theoretical arguments for \(Development \rightarrow Democracy\) convincing?

Democracy and Development in Research

  • Paglayan, 2020

    • Reconsiders whether democratization increases the provision of education. Finds that democratization can increase education provision, but that education is also a powerful for autocrats
  • Fujiwara, 2015

    • Electronic voting in Brazil reduced mistakes when voting from poorest, resulting in better accountability and more spending in health care

Democracy and Development in Research

  • Ferraz and Finan, 2008

    • Random audits of Brazilian majors reduces the chances that corrupt politicians are re-elected
  • Mori, et. al., 2024

    • Use gender quotas to examine if female politicians use local budget more or less effectively
  • Pailler, 2018

    • Democratic competition increases deforestation!

Acemoglu et. al. 2008

  • The criticism: correlation of democracy and development does not mean causation

  • Alternative: Countries embark on divergent development paths

  • Empirical implication: Observed association is correlational

Which is the correct DAG?

Empirical Tests

  • We cannot randomize development!

  • We need to control for U

  • Is this possible?

  • … if we are willing to add some assumptions

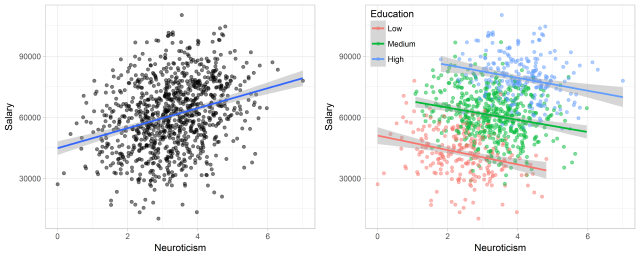
Simpson Paradox

Democracy and Development: Empirical example

pacman::p_load(readxl, tidyverse, here, estimatr)

d <- read_xls(here("./slides/code/Income-and-Democracy-Data-AER-adjustment.xls"),
    sheet = 2) %>%
    filter(is.na(lrgdpch) == F, is.na(polity4) == F) %>%
    arrange(country, year) %>%
    group_by(country) %>%
    mutate(lag_dem = lag(polity4), lag_income = lag(lrgdpch)) %>%
    ungroup()
# Polity2 Index
summary(d$polity4)
   Min. 1st Qu.  Median    Mean 3rd Qu.    Max. 
  0.000   0.150   0.700   0.573   0.950   1.000 
# Log real GDP per capita (PWT)
summary(d$lrgdpch)
   Min. 1st Qu.  Median    Mean 3rd Qu.    Max. 
  6.094   7.297   8.149   8.167   8.960  10.413 
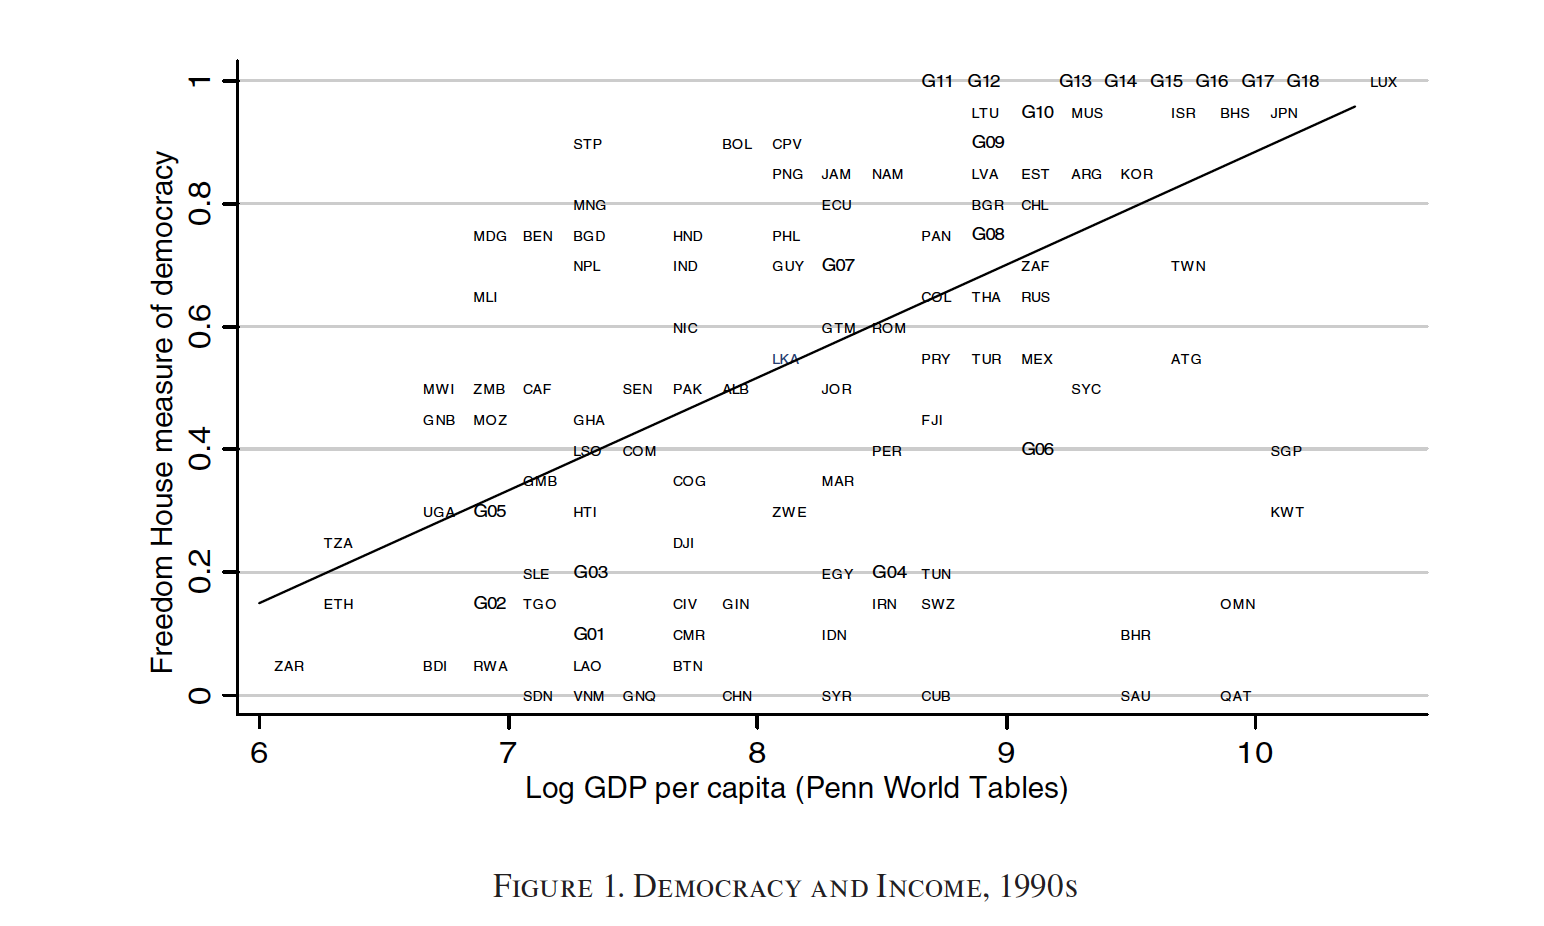
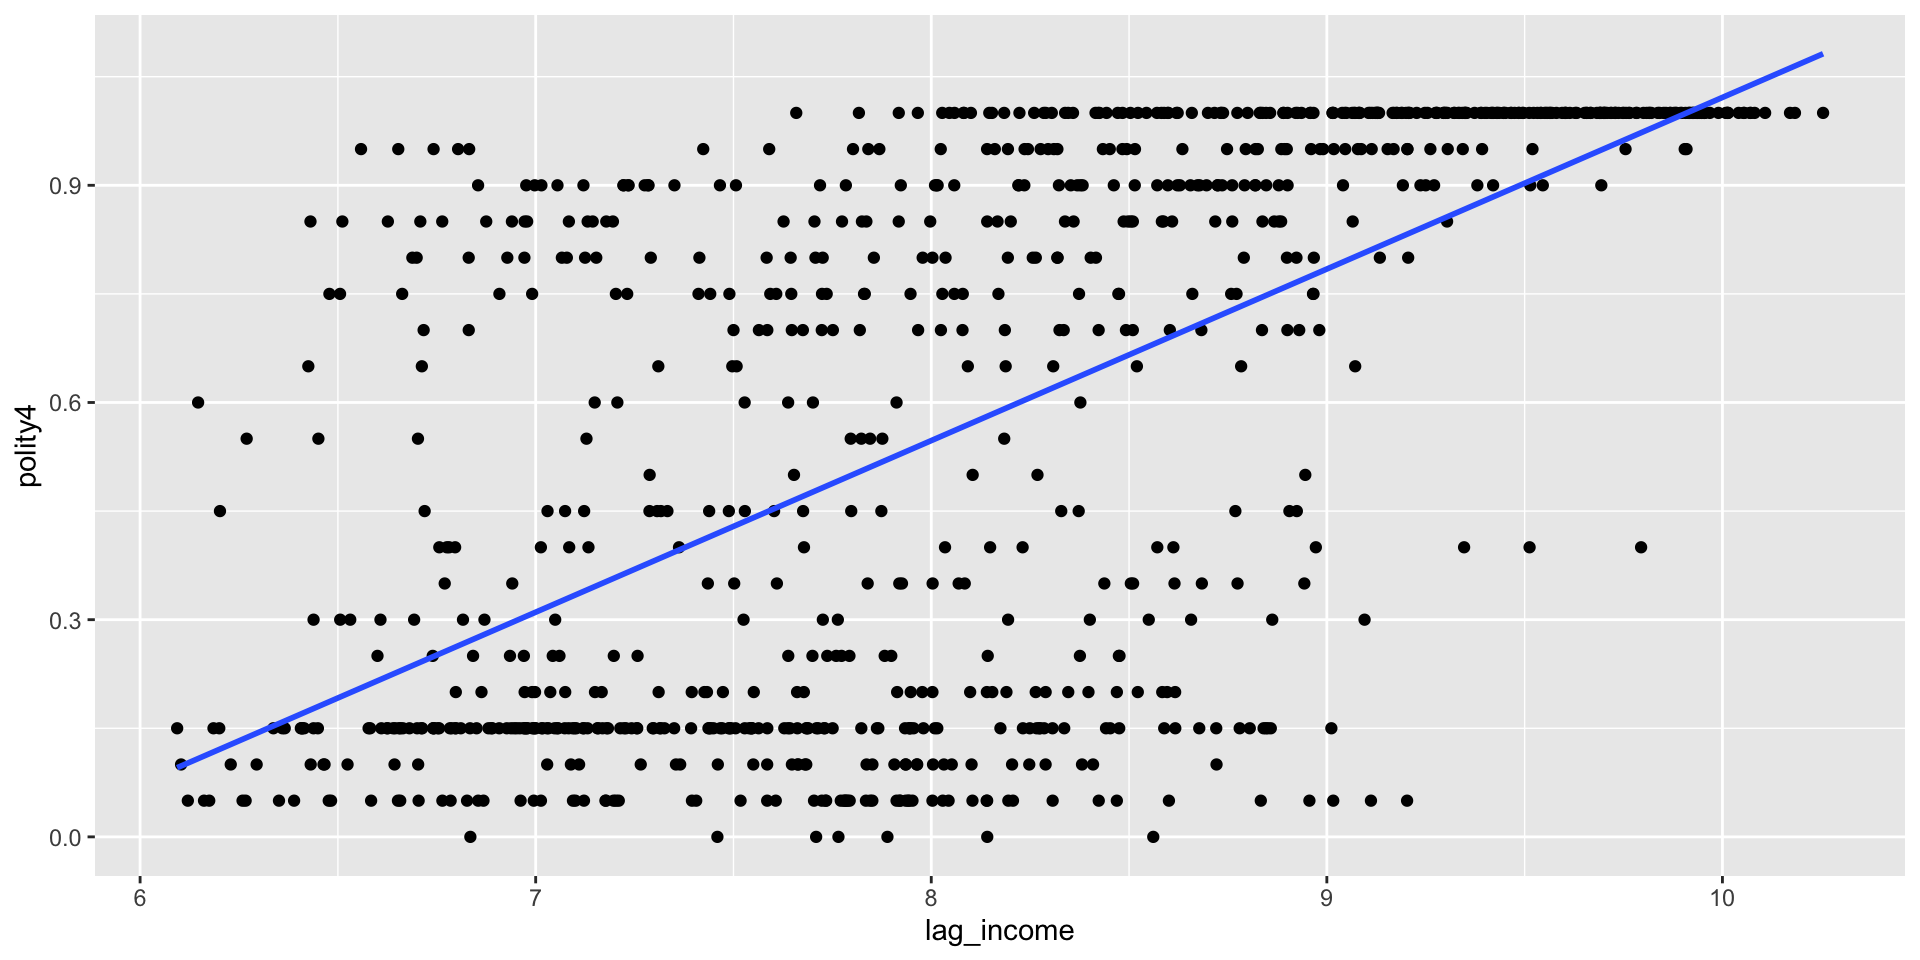
Correlation

ggplot(d, aes(y = polity4, x = lag_income)) + geom_point() + geom_smooth(method = lm,
    se = F)

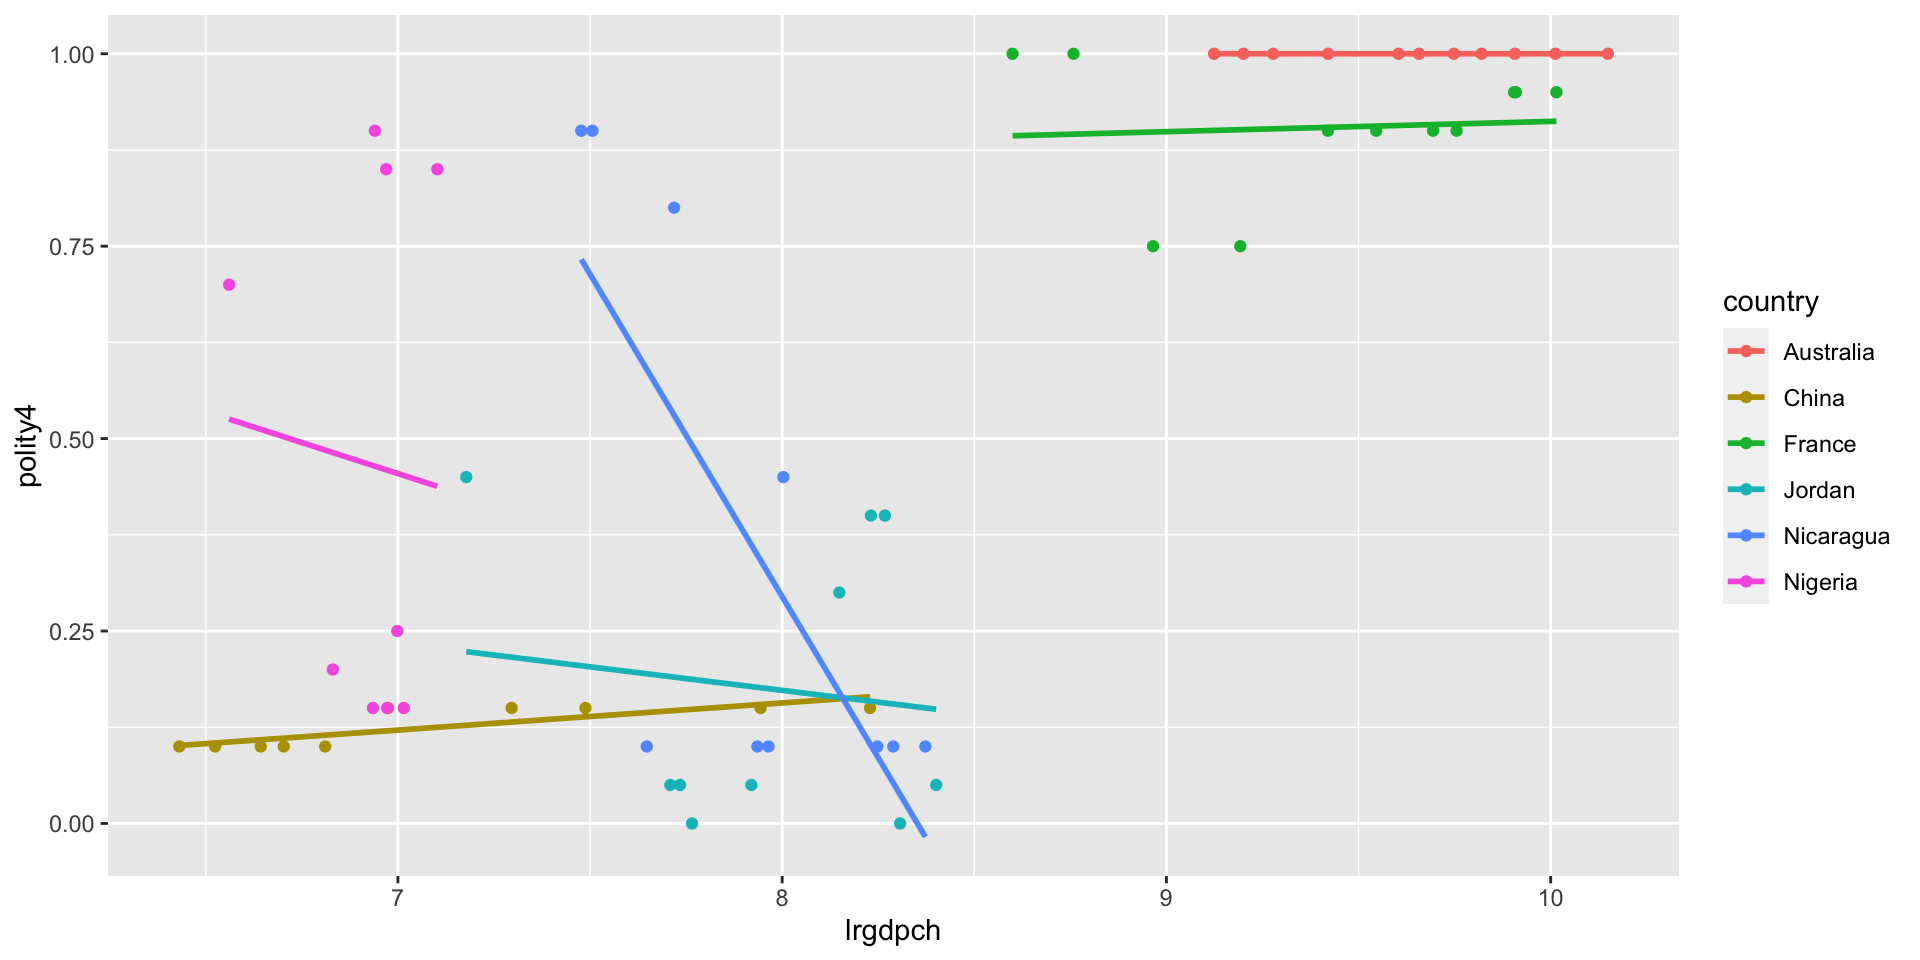
By country

Fixed effects

Simple idea: control for “belonging to a group” using group-level Fixed Effects

  • A way to control for every unobserved group characteristic that does not change

  • In practice: give an intercept to each group

  • Notice: only one slope!

Fixed effects

Go from

\[\begin{equation*} Dem_{it} = \alpha + \beta_1 Dem_{it} + \epsilon_{it} \end{equation*}\]

To

\[\begin{align*} Dem_{it} = &\alpha + \beta_1 Dem_{it} + \mu_1 USA + \\ \mu_2 France & + ... \mu_n Zimbabwe + \epsilon_{it} \end{align*}\]

Empirical example

mod <- lm_robust(polity4 ~ lag_dem + lag_income, clusters = country, data = d)
modelsummary::modelsummary(mod, stars = T, coef_omit = "(Intercept)", gof_omit = "AIC|BIC|Log.Lik|F|R2")
Model 1
lag_dem 0.742***
(0.032)
lag_income 0.063***
(0.010)
Num.Obs. 900
se_type CR2
+ p < 0.1, * p < 0.05, ** p < 0.01, *** p < 0.001

Add Fixed Effects

require(estimatr)
mod2 <- lm_robust(polity4 ~ lag_dem + lag_income, fixed_effects = country + year,
    clusters = country, data = d)

modelsummary::modelsummary(mod2, stars = T, coef_omit = "(Intercept)", gof_omit = "AIC|BIC|Log.Lik|F|R2")
Model 1
lag_dem 0.431***
(0.054)
lag_income −0.005
(0.033)
Num.Obs. 900
se_type CR2
+ p < 0.1, * p < 0.05, ** p < 0.01, *** p < 0.001

Summing up

  • Good theoretical reasons to think

    • Democracy is causally related to development
  • Most extant work focuses on the micro, sub national dynamics

  • But the broad theoretical argument is old!

  • Fixed effects can help control for time invariant unobserved confounders

  • If we think confounders might change in time (which they often do!) then FE cannot help